Market Insights: Friday, May 2nd, 2025
Market Overview
Stocks surged on Friday as the S&P 500 erased all of its post-tariff losses and extended its winning streak to nine straight sessions, the longest since 2004. A stronger-than-expected April jobs report and signs of easing tensions in the U.S.-China trade dispute buoyed investor sentiment, sparking a broad rally across all major indices. The S&P 500 climbed nearly 1.5%, pushing past its April 2 close, the day President Trump unveiled his sweeping tariff package, dubbing it “Liberation Day.” The Dow jumped over 500 points, gaining 1.4% for its ninth consecutive win, while the Nasdaq added about 1.5%. The rally was fueled by growing optimism that the worst of the trade fallout might be behind the market. China’s Commerce Ministry signaled a willingness to negotiate if the U.S. rolls back its retaliatory tariffs, a potential turning point in what has been a tense standoff. On the economic front, April’s nonfarm payrolls came in at 177,000, easily beating expectations of 138,000, and reinforcing the view that the labor market remains resilient despite recent tariff-related uncertainty. Still, tariff-sensitive names like Apple and Amazon showed signs of strain. Apple warned of a $900 million hit from tariffs this quarter and cut back its buyback program by $10 billion, dragging its shares down. Amazon, while beating earnings, delivered weak guidance that flagged trade concerns as a key factor. Overall, Friday’s action suggests markets are gaining confidence in the economic recovery narrative, bolstered by strong job numbers and the prospect of trade reconciliation.
SPY Performance
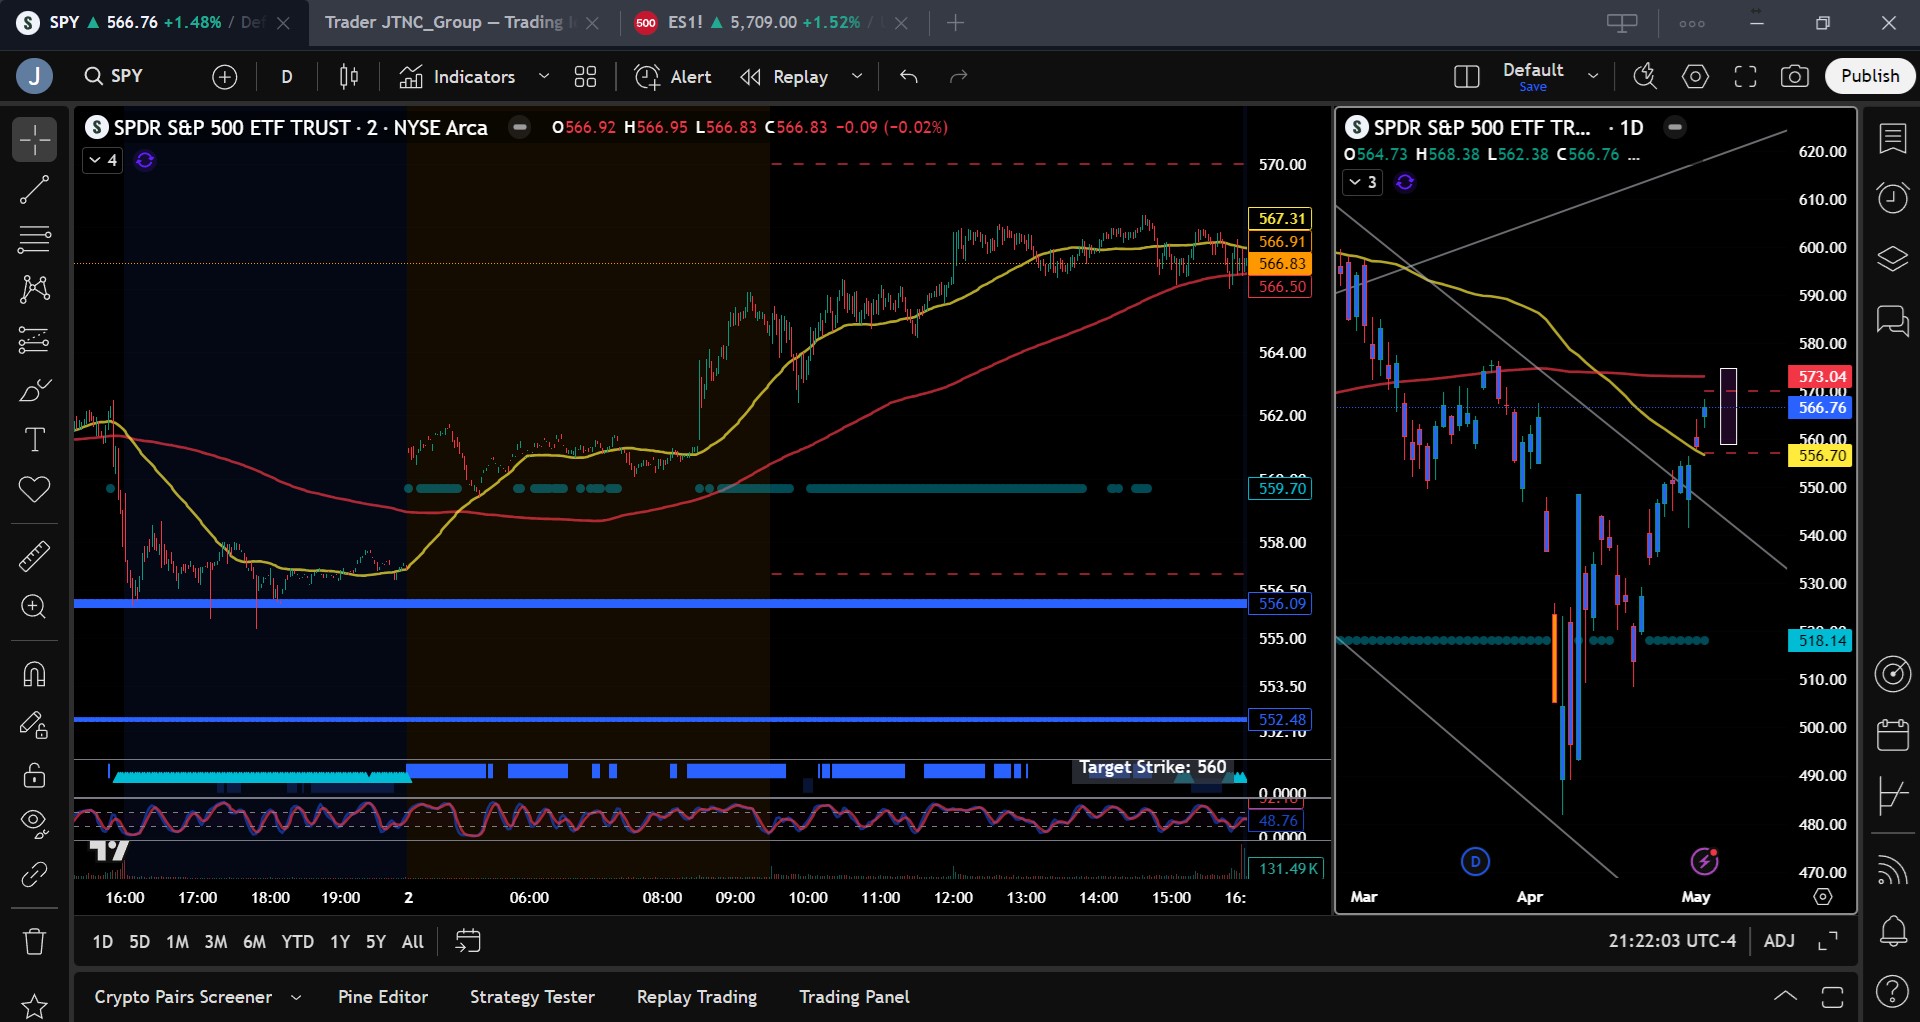
SPY closed higher by 1.48% on Friday, finishing the session at $566.76 after reaching an intraday high of $568.38. The ETF opened at $560.37 and briefly dipped to $562.38 before powering higher. Volume came in at 54.96 million shares, slightly below Thursday’s print but still about average. Friday’s breakout firmly pushed SPY above the closely watched $565 resistance zone, extending the bull run and validating bullish momentum heading into next week. Buyers remained in control from the open, and the price never retested Thursday’s close, highlighting strong demand. SPY is now trading well above the upper end of its recent range, hinting at a potential shift into a new bullish channel.
Major Indices Performance
The Russell 2000 led Friday’s rally with a 2.18% surge, bouncing back strongly from recent underperformance. The Nasdaq climbed 1.51%, as tech stocks continued to benefit from strong earnings and easing trade tensions. The S&P 500 followed with a 1.48% gain, marking its longest winning streak in over 20 years. The Dow rose 1.39%, posting its ninth consecutive advance and reclaiming levels not seen since February. Friday’s labor report and signs of a potential softening in U.S.-China trade tensions helped fuel broad-based buying across sectors. Growth names once again outpaced defensive sectors, which lagged as traders rotated back into tech, small caps, and cyclicals amid renewed optimism.
Notable Stock Movements
Meta led the Magnificent Seven with a 4.28% rally, continuing its post-earnings surge. Nvidia, Microsoft, Google, and Tesla all posted solid gains above 1.6%, reinforcing Big Tech’s leadership. Apple fell sharply, down 3.76%, after warning of a massive $900 million tariff headwind this quarter and trimming its buyback program. Amazon slipped 0.12%, as concerns over its weak guidance offset an earnings beat. Despite these outliers, the group mostly stayed in the green, supporting broader index gains and confirming that investors are still confident in the tech recovery story, even as trade concerns weigh on some names.
Commodity and Cryptocurrency Updates
Crude oil held steady with a 1.34% gain to $58.99, continuing its slow grind toward our longstanding $60 target. While we still anticipate a medium-term drop to $50 as interest rates rise, oil could rally short-term if the dollar continues to weaken. Gold bounced slightly, rising 0.80% to $3,248 as traders sought a hedge ahead of the weekend, though it remains off recent highs. Bitcoin closed just above $96,700 with a modest 0.33% gain. We remain long-only, preferring to buy dips between $77,000 and $83,000, and to take profits above $85,000. We continue to avoid any buying below $77,000 due to downside risk.
Treasury Yield Information
The 10-year Treasury yield rose 1.82% to close at 4.308%, a notable climb that brings it closer to the critical 4.5% threshold. Yields above 4.8% would signal real trouble for equities, with 5.2% likely sparking a 20% market correction. The current trend in yields reflects improving sentiment around the labor market but also raises concerns about tightening financial conditions. Rising yields are a clear headwind for stocks, especially growth names, though for now the equity rally appears strong enough to absorb the pressure.
Previous Day’s Forecast Analysis
Thursday’s forecast projected a wide range from $549.75 to $571.50, with a bullish bias if SPY held above $556. Upside targets were set at $565 and $570, while a failure below $552 could lead to a test of $545. The strategy favored long trades above $556, warning that a failure at $545 could push SPY toward $535. The model cautioned traders to avoid chasing breakouts near resistance and emphasized the importance of managing risk into Friday’s jobs data. This analysis highlighted $560 and $565 as key resistance levels and reinforced the need to stay nimble amid expected volatility.
Market Performance vs. Forecast
Friday’s session adhered closely to the prior day’s forecast. SPY opened strong at $560.37, never tested the lower support zones, and surged above $565 to close at $566.76. The intraday high of $568.38 exceeded Thursday’s upside target of $565, moving toward the upper end of the model’s projected range of $549.75 to $571.50. The primary bias level of $560 served as a reliable floor throughout the session. Traders who entered long trades above $556 were rewarded, particularly if they took profits near resistance as advised. The rally confirmed bullish control, and the forecast once again proved accurate in identifying key levels and the potential for a strong upward move following favorable economic data.
Premarket Analysis Summary
In Friday’s premarket analysis posted at 8:34 AM, SPY was trading at $560.89 with a bias level of $563. The outlook leaned cautious but noted that a break above $563 could spark a rally toward $565 and beyond. Downside targets were set at $557 and $553 if SPY failed to hold above the bias level. The market was expected to be brittle and reactive to post-market earnings and tariff news, with early profit-taking favored on any strength. The guidance emphasized the importance of holding above key levels to validate any bullish continuation.
Validation of the Analysis
Friday’s trading respected the premarket outlook. SPY initially slipped toward the bias zone but quickly reclaimed $563, pushing through resistance to hit $568.38 before closing at $566.76. The projected upside targets of $563 and $565 were both hit with conviction, and while the stretch target of $570 remained out of reach, the analysis accurately anticipated strong bullish follow-through once $563 was cleared. The market never tested the downside targets of $557 or $553, validating the view that weakness would be bought. Traders following the plan were able to capitalize on the move, reinforcing the value and precision of the premarket analysis.
Looking Ahead
Looking at Monday, the ISM PMI report will headline the economic calendar and could spark renewed volatility. With SPY breaking out above $565, traders will be watching closely to see if it can hold gains and establish a new trading range above prior resistance. The broader trend remains bullish, but with the FOMC meeting on Wednesday, any hawkish rhetoric could shake markets. Until then, expect price action to consolidate between key levels as traders digest this week’s strong data and prepare for the Fed’s policy update.
Market Sentiment and Key Levels
SPY closed the week at $566.76, extending its bullish breakout and testing above the upper boundary of the $555–$565 resistance zone. Market sentiment remains constructive, bolstered by positive jobs data and signs of trade negotiations resuming. Resistance now lies at $567, $570, and $574. Support comes in at $565, $560, and $558. A sustained move above $567 opens the door to a test of $570, while a break below $560 could signal a retest of $555. Bulls currently control the tape, but caution is warranted ahead of next week’s macro events. Volatility remains a factor as we head into a critical week with the Fed on deck.
Expected Price Action
Our AI model projects a trading range of $559 to $574.75 for Monday, offering actionable intelligence for traders. The market bias remains bullish, and we expect consolidation above $565 if SPY holds recent gains. Upside targets include $570 and $574, with a possible stretch to $580 if momentum accelerates. If SPY stalls or slips below $565, a decline to $560 or $558 is possible, with $554 serving as deeper support. If $554 breaks, expect a move toward $545. Traders should watch for failed breakouts near resistance or failed breakdowns near support. The market is at a turning point, either consolidating gains or retracing the recent rally depending on incoming data and sentiment shifts.
Trading Strategy
Long trades are favored above $560, targeting $570. A breakout through $574 could open the door to $580. Short trades may be considered below $560 or above $565, with downside targets at $558. With the VIX dropping to 22.68, volatility is easing but remains elevated. Traders should continue to use tight stops when trading near resistance and manage risk carefully as macro news hits. This is not a time to be overleveraged—trade smaller and stay nimble until we see confirmation of trend continuation or reversal. Watch for failed breakouts above $567 or failed breakdowns below $560 as potential setups.
Model’s Projected Range
The model’s maximum projected range for Friday is $559 to $574.75, with the Call side dominating suggesting consolidation with perhaps a retracement the recent nine days of gains. After such a strong run, we still believe a day or two of consolidation is warranted. Notably, nearly 300 of the 330 companies that have reported earnings so far this quarter have cited “uncertainty” and difficulty forecasting future revenue. This signals potential trouble ahead for Q3, which could rock the market and trigger a retest of the April lows. While Q2 may benefit from some pull-forward effects and still deliver solid results, longer-term, we expect the market to react more negatively to any disappointing news from corporate America. For Monday, the projected range is narrowing, suggesting more sideways movement rather than a decisive move higher. SPY made an attempt today to break out of the $555–$565 zone. Monday will show whether price can remain above $565 and establish a new, broader range between $555 and $575. Bulls are steadily adding to their advantage, especially as SPY trades near and above the 200-day moving average. Upside targets for Monday include $570 and $575. However, a break below $555 could signal the start of a corrective move, with $545 as the next major support. A failure there could lead to a deeper decline. We continue to favor two-way trading, viewing the current rally as a relief move within a broader bear market context. Key technical levels for Monday: Resistance: $567, $570, $574, $580. Support: $565, $560, $558, $554. The wall of resistance above $567 remains formidable, while support below $565 is showing signs of weakening. Today’s Jobs Report gave the market enough confidence to rally for an eighth straight day, pushing SPY above $565. Still, bulls need a close above $585 to fully reclaim control of the broader trend. Conversely, a break below $545 could trigger a retest of $535 and if that fails, a gap-fill move toward $530 becomes likely. Tariffs, bond yields, and inflation will remain key macro drivers over the next 90 days or until clearer signals emerge from the White House. The VIX closed lower at 22.68, under the critical 23 level, providing near-term support for equities. With SPY settling above $566, bulls continue to gain traction, now trading above the upper boundary of the bear trend channel that has held since December. Our model hasn’t redrawn the channel yet, as it remains unconvinced that this rally has lasting power. However, should the upward momentum continue next week, a new bullish trend channel is likely to emerge. Momentum currently favors the bulls but in a volatile environment like this, staying nimble and prepared for rapid sentiment shifts remains essential.
Market State Indicator (MSI) Forecast
Current Market State Overview:
The MSI is currently in a Bullish Trending Market State having rescaled into yesterday’s close to its current state. SPY closed well above MSI resistance turned support and extended targets printed for much of today’s session. The MSI range is wide, indicating a strong bull trend but one which is likely to stall soon. The MSI did not rescale today which tells us the bulls are running out of steam. But with extended targets printing for virtually the entire session, the herd pushed SPY to a high of $568.38 with extended targets forecasting the rise. Extended targets ceased printing the last hour, but SPY held up well, closing well above the MSI. Currently MSI support is at $556.09 and lower at $552.48.
Key Levels and Market Movements:
On Thursday, we noted ahead of today’s Jobs Report: “Don’t be surprised if SPY moves $10 or more premarket.” We also stated: “After the release, expect trending action at least through the morning session.” Finally, we highlighted: “If bulls hold above $555, a push toward $570 is likely.” With this actionable intelligence in hand, and SPY opening above $565 well above MSI support, we were initially hesitant to chase the firmly established long trend that followed the premarket release. A quick sell-off after the open brought SPY down to $562.33, setting up a less-than-perfect failed breakdown. Extended targets briefly stopped printing, but we decided a long trade from $563.50 to the recent high at $566 was worth a calculated risk. As soon as we entered the trade, extended targets resumed printing, reinforcing our decision to hop on the rally. SPY quickly reached $566, where we exited 70% of our position. Our next premarket level was $570, which we set as the second target for another 20% of the trade. However, we recognized that the move would likely be toward $570, not necessarily to it. As we often say: when new information hits the market, trade what you see. By noon, SPY had spiked to $567.90 and then moved sideways for several hours. At 2:36 PM, a textbook failed breakout signaled it was time to exit the long. While we briefly considered reversing short, extended targets were still printing and we never fight extended targets. Given it was Friday, after a week of strong gains, we closed the final 30% of our position and called it a weekend. Another one-and-done day, driven by disciplined execution, a solid plan, and guidance from the MSI and our model’s levels. The MSI reveals who’s in control, when control shifts, and where key actionable levels lie, enabling precise entries and exits. When paired with our model’s levels, it helps keep traders aligned with dominant market forces. It continues to deliver with high precision, helping traders avoid traps, stay in sync with momentum, and capture profits with confidence. We strongly recommend integrating the MSI into your trading toolkit. When combined with a structured plan, it becomes a powerful engine for long-term performance.
Trading Strategy Based on MSI:
Monday brings the Services PMI, which could move the market, but the main event this week is Wednesday’s FOMC Statement. Typically, markets consolidate ahead of the Fed, moving sideways to build energy for a breakout or breakdown. After nine consecutive days of gains, we could see a “Manic Monday” featuring a retracement of some of those sharp advances. A back test of the bear trend channel, currently near $545, would not surprise us. Even a move down to that level would still leave bulls firmly in control of the broader trend. That said, as long as $560 holds, the bulls remain poised to drive SPY another $10 higher toward $575 and potentially beyond. The MSI has not rescaled and remains in a wide bullish state. Given that extended targets printed virtually all-day Friday without triggering a rescale, we believe price is more likely to retrace on Monday. Should $560 fail, bears will attempt to push SPY down to $545. However, with short sellers having been punished during this rally, it’s unclear how much strength remains on the bearish side. The $560 and $545 levels will be key if they’re tested at all. A nine-day rally isn’t unprecedented, but it is stretched. With SPY nearing its 200-day moving average at $573, this may be a logical spot for the market to pause or pull back. We’ve been noting that as price enters the $565–$585 zone, institutional players are likely to start trimming positions and deploying protective strategies ahead of the summer slowdown. As such, we believe we’re entering a region where further upside could be limited. Monday Scenarios: Bullish: If bulls hold above $560, a push toward $575 remains likely. Bearish: A failure to hold $560 opens the door to a retest of $545 or potentially lower. Key Support: Breakdown below $545 could trigger a move toward $535. If $535 fails, gap fill toward $525 is possible. Key Resistance: Bulls remain in control above $535, but the $565–$585 zone is vulnerable to stalling or reversal. Bulls won’t regain full control until SPY reclaims $585. Expect two-way trading opportunities. Shorts become attractive above $565, while long setups may emerge below $560. Focus on failed breakouts and breakdowns near these critical levels. Avoid trading into extended targets or fighting the broad MSI range. As always, trade what’s in front of you. Lean on the MSI and stay nimble. The Premarket Report delivers fresh data and AI-driven insights to guide your daily plan. The MSI updates in real-time, revealing intraday structure and momentum shifts so you can avoid stale narratives. Paired with our model levels, which highlight high-probability targets and precise entry zones, these tools help you stay aligned with dominant market forces and avoid costly mistakes. If you're not yet using the MSI and model levels, now is the time. Reach out to your rep as they’re true game-changers in a market like this.
Dealer Positioning Analysis
Summary of Current Dealer Positioning:
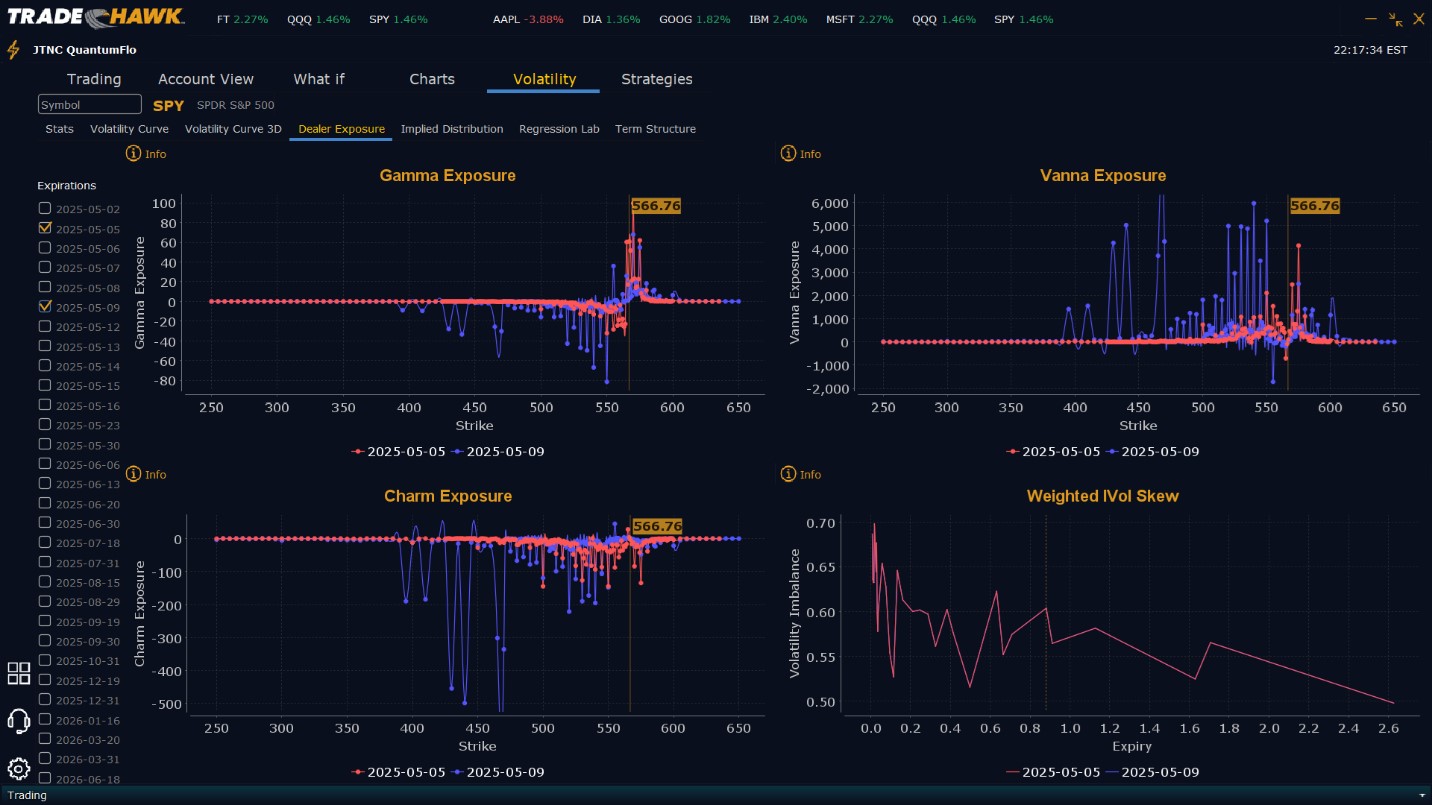
Dealers are selling $567 to $580 and higher strike Calls while also selling small quantities of $565 - $566 Puts. Dealers do not typically sell close to the money Puts unless they are convinced prices will move higher. The upside, however, also looks limited to $575 for Monday. To the downside Dealers are buying $564 to $500 and lower strike Puts in a 2:1 ratio to the Calls/Puts they are buying/selling, implying a neutral posture for Monday. Dealer positioning has changed from slightly bearish to neutral.
Looking Ahead to Next Friday:
Dealers are selling $567 to $605 and higher strike Calls while also selling $555 Puts implying the Dealers belief that price may pullback some but likely not fall beyond $555. Dealers believe the market peak for next week is $575. To the downside, Dealers are buying $565 to $490 and lower strike Puts in a 4:1 ratio to the Calls/Puts they’re buying/selling. This reflects a bearish outlook for next week. Dealers are heavily protected should $550 fail but are also open to prices reaching $575 next week. Dealer positioning is unchanged from bearish to bearish. We advise reviewing Dealer positioning daily for directional clues. These positions evolve quickly and tracking them is essential for staying ahead of shifting market sentiment.
Recommendation for Traders
With SPY pushing through $565 and closing strong at $566.76, long trades remain favored above $560 with upside targets at $570. Short trades are recommended below $560 and above $565, targeting $558. While the VIX has dropped to 22.68, signaling a short-term drop in volatility, the market remains sensitive to macro events and trend shifts. Keep stops tight near resistance and consider lightening up positions ahead of Wednesday’s FOMC announcement. Traders should continue monitoring how price reacts to key levels and avoid chasing extended moves. Review Monday’s premarket analysis before 9 AM ET to account for any overnight developments or changes in Dealer Positioning.
Good luck and good trading!
Do you want to get live AI Newsletter updates daily?
